
Email Insights in MailVault: Who Fills Your Inbox, and When
Insights is the part of MailVault that turns your mailbox into email insights you can act on: a sender map, a timeline and an activity calendar that show who writes to you, how often, and on which days the mail piles up. This post walks through each view, shows how to find your biggest senders, and what to do once you have found them. If your real problem is a full mailbox and you want space back today, start with the guide to freeing up email storage without losing old mail instead.
Quick answer
- Open Insights in the MailVault sidebar. It is free and needs no account.
- To see who sends you the most mail, open the Sender map and set Sort senders to Message count.
- To see when mail piles up, open Activity: one square per day, darker for busier days.
- Everything is built from the message headers already on your computer. The charts do not upload anything.
What Insights shows
Insights opens full screen from the sidebar and has three tabs. They share the same controls at the top: which account, which date range (last 30 days, last 90 days, last 12 months or dates you choose), which direction (mail received, mail sent, or both), and a Hide likely automated senders checkbox. That last one takes out senders whose mail looks machine-sent: a no-reply address, or the List-Id, List-Unsubscribe or bulk Precedence headers that mailing lists add.
| View | What it draws | The question it answers |
|---|---|---|
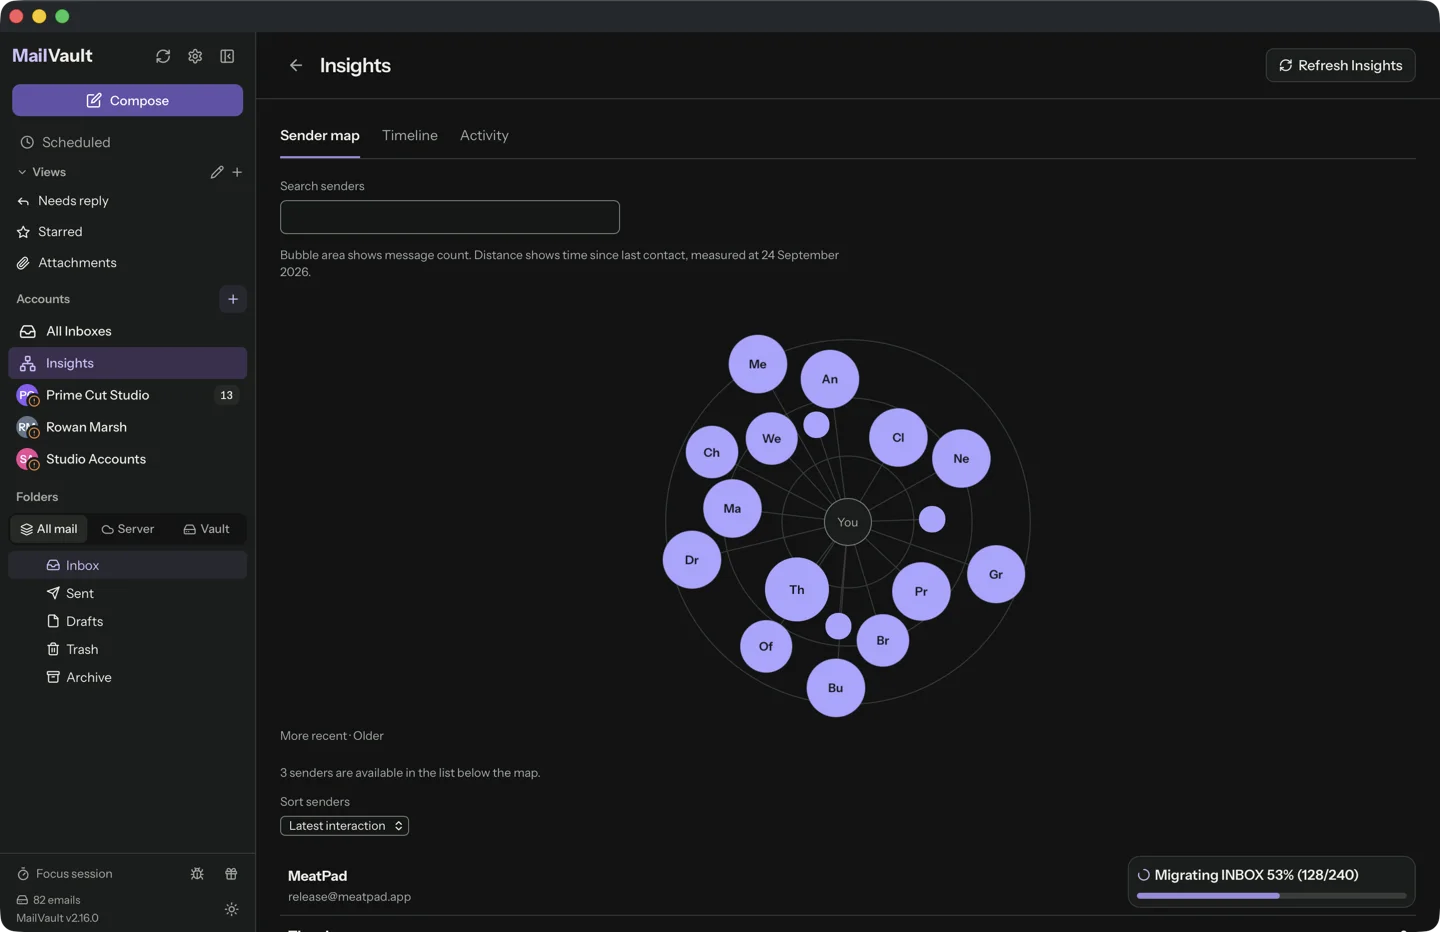
| Sender map | You in the middle, each sender as a bubble. Bubble area is message count, distance is time since last contact. | Who writes to me most, and who has gone quiet? |
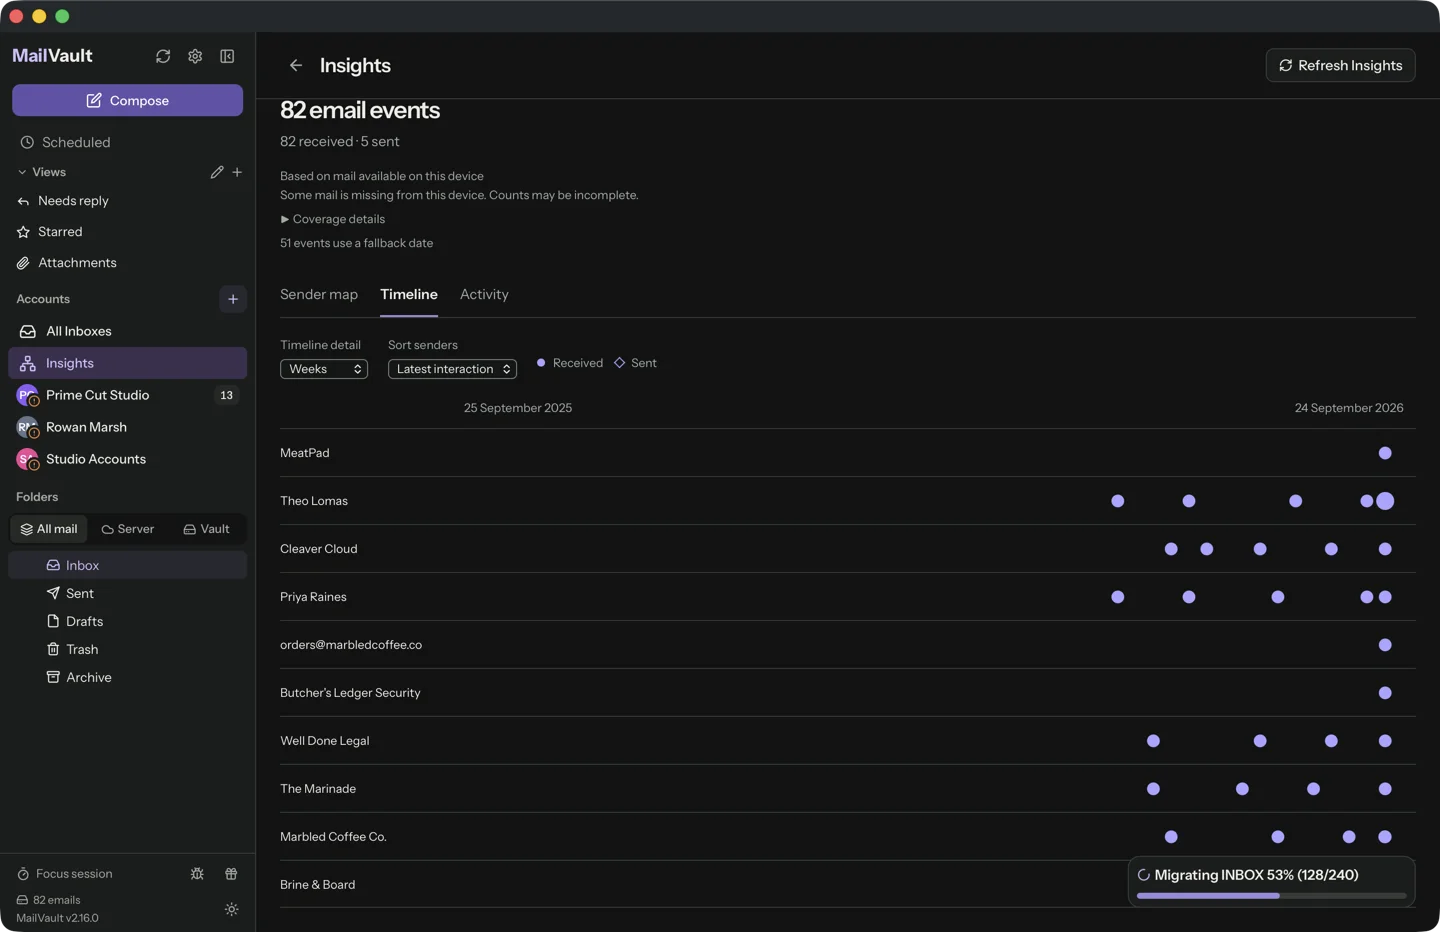
| Timeline | One lane per sender across a time axis. Circles for mail received, diamonds for mail sent. Detail by weeks, days or single messages. | How often does this sender write, and do I ever reply? |
| Activity | A calendar grid, one square per day, shaded by how much mail moved that day. | When does mail pile up? |
Every view is clickable. Click a bubble, a point on a lane or a day, and the matching messages open in a list, where you can read them without leaving Insights.
Find who sends you the most mail
- Open Insights and pick the account in Accounts. Insights looks at one account at a time.
- Set Date range to Last 12 months and Direction to Received.
- On the Sender map, the largest bubbles are your biggest senders. Under the map, change Sort senders from Latest interaction (the default) to Message count to get them as a ranked list with numbers.
- Click a sender to see their received and sent counts, the date of last contact, and why they count as automated if they do.
Then do it twice: once with Hide likely automated senders off, once with it on. The first list is usually newsletters, shops and notifications. The second is the people you actually correspond with, which is often much shorter.
Which senders take the most space?
Here Insights has a limit worth knowing: it counts messages, not megabytes. A sender with 900 short notifications fills the map, while a client who sent six large PDFs barely shows. Message count is a rough stand-in for space, good for finding clutter, not for finding the heavy mail.
For the heavy mail, look at attachments. Text is small; files are what make a message large. Two ways to find them in MailVault:
- The built-in Attachments view in the sidebar lists messages that carry files.
- Search with operators, for example
from:name has:attachment, to see one sender's mail with files. Addbefore:2024-01-01to limit it to older mail.
Combine the two: Insights tells you who sends a lot, and the search tells you which of them send big.
See when mail piles up
The Activity tab is the quickest picture of your email year. Each square is a day; darker squares mean more mail. Patterns show up fast: a wave of mail every Monday, a quiet August, a week in spring when a project buried your inbox. Click a square and you see exactly what arrived that day.
The Timeline tab tells the same story per sender. A newsletter shows as a steady row of dots, a busy client as a dense cluster, and a relationship that went one-sided as a lane of circles with no diamonds. Change Timeline detail between weeks, days and messages to zoom in.
Act on what you found
Insights is for looking. The cleanup happens in the normal mail view, and Explorer makes it quick:
- Go back to the folder and switch the message list from List to Explorer.
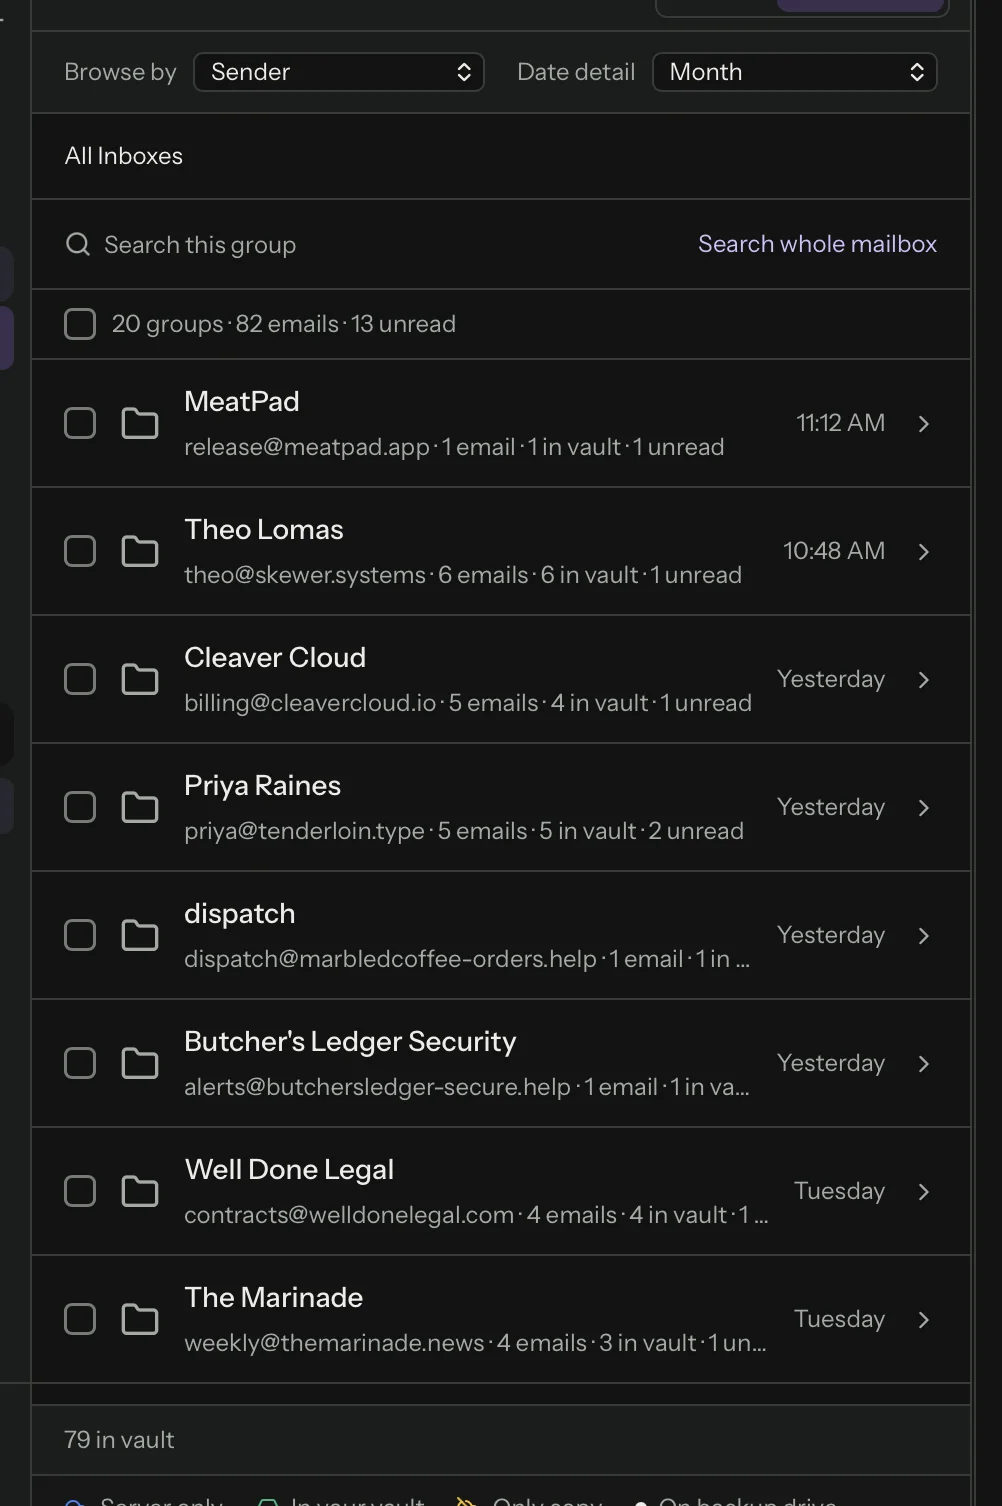
- Set Browse by to Sender. Each correspondent becomes one group, with how many emails it holds, how many are already in your vault and how many are unread.
- Tick the checkbox on a sender's row to select every message in that group at once. In a large mailbox, if Explorer says "Groups reflect loaded emails. More mail is available.", load more emails first so the group holds all of that sender's mail.
- Choose what to do: Archive copies them into your vault and leaves the server alone (free). Delete from Server removes them from the server (free). Anything already in your vault keeps its copy, but anything that is not is gone for good, so archive first. Archive & Delete saves each one into the vault, checks it, then removes the server copy (Premium).
For mailing lists, there is a shorter route. When a sender's mail carries an unsubscribe link, the sender details in Insights show an Unsubscribe button. MailVault always asks first. If the list supports one-click unsubscribe and the message passed DKIM, MailVault sends the request itself; otherwise it opens the list's unsubscribe page in your browser, or a ready-made unsubscribe email.
If you find the same kinds of mail coming back every month, Email Cleanup (Premium) can sort newsletters, promotions and other categories and keep, archive or delete each one, with rules by age per account and folder.
Computed on your computer
Insights reads the message headers MailVault already holds on your disk: sender, recipients and dates, from the cached headers of folders you have opened and the messages in your vault. It does not read message bodies or attachments to draw the charts, and nothing is sent to MailVault. There is no MailVault account involved, and the charts work with the network off.
Two actions do reach out, and only when you choose them. Opening a message from Insights loads it the normal way, which can mean downloading it from your own mail server. Unsubscribe contacts the mailing list, as described above.
Because Insights only knows what is on this device, it tells you how complete the picture is. A note under the controls reads "Based on mail available on this device", and Coverage details lists each folder with how many headers are stored locally next to how many messages the server is known to hold. If some mail is missing, it says counts may be incomplete. If a message had no reliable date, it says how many events use a fallback date. Treat a quiet month as a fact only when coverage is complete. To make it complete, save more of the mailbox to your computer first; our guide on what an email vault is and how to build one covers that.
Frequently asked questions
Is MailVault Insights free?
Yes. Insights and Explorer are part of the free app, with no account and no sign-in. They arrived in MailVault 2.13.0.
Does Insights upload my email anywhere?
No. Insights is built from header data already stored on your computer. The charts do not read message bodies or attachments, and nothing is uploaded to any service.
Can Insights show all my accounts at once?
No. Insights looks at one account at a time. Switch accounts with the Accounts menu at the top of the page.
Why are my numbers lower than in webmail?
Insights only counts mail whose headers are on this computer. Open Coverage details to see, per folder, how many headers are stored locally and how many messages the server is known to hold. Save more of the mailbox locally, then press Refresh Insights.
Can Insights tell me which senders use the most storage?
Not directly. Insights ranks senders by message count, not by size. To find large mail, use the Attachments view or a search such as from:name has:attachment.
What to do next
Open Insights on your busiest account, sort the Sender map by message count, and look at the top ten with automated senders shown and hidden. Note the newsletters you no longer read and the notification senders that could go to a folder or a rule. The Insights feature page and the Explorer and Insights FAQ have more detail. If your mailbox is close to its limit, the guide to what to do when Outlook storage is full picks up from here.
See who fills your inbox.
Insights is in the free MailVault app for macOS, Windows and Linux. No account with us, and the charts are built on your computer.